Human/Mouse PEA-15 Antibody Summary
Ala2-Ala130
Accession # Q15121
Customers also Viewed
Applications
Please Note: Optimal dilutions should be determined by each laboratory for each application. General Protocols are available in the Technical Information section on our website.
Scientific Data
 View Larger
Detection of Human PEA‑15 by Western Blot. Western blot shows lysates of A172 human glioblastoma cell line and human cortex tissue. PVDF membrane was probed with 1 µg/mL of Sheep Anti-Human/Mouse PEA-15 Antigen Affinity-purified Polyclonal Antibody (Catalog # AF5588) followed by HRP-conjugated Anti-Sheep IgG Secondary Antibody (Catalog # HAF016). A specific band was detected for PEA-15 at approximately 15 kDa (as indicated). This experiment was conducted under reducing conditions and using Immunoblot Buffer Group 8.
 View Larger
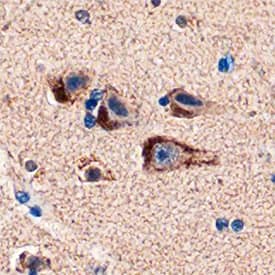
PEA‑15 in Human Brain. PEA-15 was detected in immersion fixed paraffin-embedded sections of human brain (cortex) using Sheep Anti-Human/Mouse PEA-15 Antigen Affinity-purified Polyclonal Antibody (Catalog # AF5588) at 1 µg/mL overnight at 4 °C. Tissue was stained using the Anti-Sheep HRP-DAB Cell & Tissue Staining Kit (brown; Catalog # CTS019) and counterstained with hematoxylin (blue). Specific staining was localized to neurons. View our protocol for Chromogenic IHC Staining of Paraffin-embedded Tissue Sections.
 View Larger
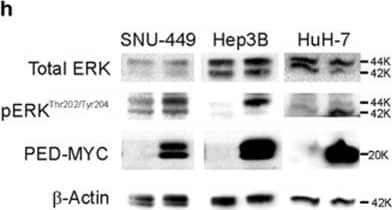
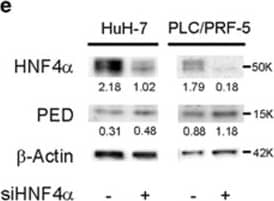
Detection of Human PEA-15 by Western Blot PED is inversely correlated to HNF4 alpha expression. (a) SNU-449 cells were co-transfected with 100 ng of pPED477 PED promoter-luciferase or pGL3 basic construct and treated with siRNA against HNF4 alpha or siRNA control. Luciferase activity was normalized for Renilla activity and is presented as mean±S.D. A representative experiment in triplicate is shown. (b,c) PED expression levels in HCC samples (b; n=59) or corresponding non-tumoral liver tissue (c, n=59) were correlated with HNF4 alpha expression. Correlation was calculated by Spearman test. Data are reported as probe intensity of an mRNA transcriptome array. (d) Western blot analysis for HNF4 alpha and PED in two HCC patient tumor samples and their corresponding non-tumoral (NT) tissues. Calnexin was used as loading control. Arrow: canonical full length HNF4 alpha (52 kDa); other bands are isoforms or truncated forms of the protein. (e,f) HuH-7 and PLC/PRF/5 cell lines were transfected with siRNA against HNF4 alpha (siHNF4 alpha ) or siRNA control. After 72 h the protein expression of HNF4 alpha and PED was measured by western blot (e) and beta -actin served as control. mRNA expression was measured by qPCR (f) using RNA 18 S as internal control at 48 h for HuH-7 and 72 h for PLC/PRF/5. Data are reported as mean±S.D. of two independent experiments performed in triplicate. (g) SNU-449 cells were transfected with siRNA against HNF4 alpha or siRNA against PED alone or in combination, or siRNA control, as indicated. Migration was assessed by CIM plate with xCELLigence apparatus after 12 h and 24 h. Data are reported as mean±S.D. of two independent experiments performed in triplicate. (h) Western blot analysis of pERKThr202/Tyr204 and ERK in SNU-449, Hep3B and HuH-7 cell lines transfected with PED-MYC. beta -Actin was used as loading control. (i) pERKThr202/Tyr204 expression in two HCC patients and their non-tumoral counterpart. Calnexin was used as loading control. *P<0.05, **P<0.01, ****P<0.0001 Image collected and cropped by CiteAb from the following publication (https://www.nature.com/articles/cddis2017512), licensed under a CC-BY license. Not internally tested by R&D Systems.
 View Larger
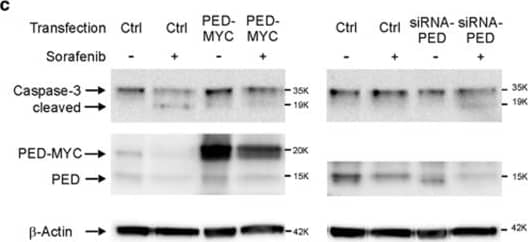
Detection of Human PEA-15 by Western Blot PED confers resistance to sorafenib therapy. (a) HuH-7 and SNU-449 cells were transfected with siRNA against PED or siRNA control. Afterwards, HuH-7 and SNU-449 cells were treated with 10 μM and 20 μm respectively of sorafenib or left untreated. Cell growth was evaluated by using the xCELLigence instrument at the indicated time. Data are reported as mean±S.D. of two independent experiments performed in triplicate. (b) HuH-7 and Hep3B cells were transfected with PED-MYC vector for 24 h and then seeded in a 96-well plate. 10 μm of sorafenib was added and 24 h or 48 h later, cell viability was measured by a MTT assay. Data are reported as mean±S.D. of two independent experiments perfomed in triplicate. (c) HuH-7 cells were transfected with PED-MYC or empty vector (Ctrl) and siRNA against PED or siRNA control (Ctrl), as indicated. After 24 h, cells were treated with 10 μM or 7 μM sorafenib, respectively, for 48 h and caspase-3 activation was measured by western blot. (d) HuH-7 cells were transfected with siRNA against PED or control siRNA. Afterwards, cells were treated with 10 μM sorafenib and 48 h later caspase-3/7 assay activation was measured. Data are reported as mean±SD of one experiment performed in triplicate. *P<0.1, **P<0.01, ***P<0.001, ****P<0.0001 Image collected and cropped by CiteAb from the following publication (https://www.nature.com/articles/cddis2017512), licensed under a CC-BY license. Not internally tested by R&D Systems.
 View Larger
Detection of Human PEA-15 by Western Blot PED is inversely correlated to HNF4 alpha expression. (a) SNU-449 cells were co-transfected with 100 ng of pPED477 PED promoter-luciferase or pGL3 basic construct and treated with siRNA against HNF4 alpha or siRNA control. Luciferase activity was normalized for Renilla activity and is presented as mean±S.D. A representative experiment in triplicate is shown. (b,c) PED expression levels in HCC samples (b; n=59) or corresponding non-tumoral liver tissue (c, n=59) were correlated with HNF4 alpha expression. Correlation was calculated by Spearman test. Data are reported as probe intensity of an mRNA transcriptome array. (d) Western blot analysis for HNF4 alpha and PED in two HCC patient tumor samples and their corresponding non-tumoral (NT) tissues. Calnexin was used as loading control. Arrow: canonical full length HNF4 alpha (52 kDa); other bands are isoforms or truncated forms of the protein. (e,f) HuH-7 and PLC/PRF/5 cell lines were transfected with siRNA against HNF4 alpha (siHNF4 alpha ) or siRNA control. After 72 h the protein expression of HNF4 alpha and PED was measured by western blot (e) and beta -actin served as control. mRNA expression was measured by qPCR (f) using RNA 18 S as internal control at 48 h for HuH-7 and 72 h for PLC/PRF/5. Data are reported as mean±S.D. of two independent experiments performed in triplicate. (g) SNU-449 cells were transfected with siRNA against HNF4 alpha or siRNA against PED alone or in combination, or siRNA control, as indicated. Migration was assessed by CIM plate with xCELLigence apparatus after 12 h and 24 h. Data are reported as mean±S.D. of two independent experiments performed in triplicate. (h) Western blot analysis of pERKThr202/Tyr204 and ERK in SNU-449, Hep3B and HuH-7 cell lines transfected with PED-MYC. beta -Actin was used as loading control. (i) pERKThr202/Tyr204 expression in two HCC patients and their non-tumoral counterpart. Calnexin was used as loading control. *P<0.05, **P<0.01, ****P<0.0001 Image collected and cropped by CiteAb from the following publication (https://www.nature.com/articles/cddis2017512), licensed under a CC-BY license. Not internally tested by R&D Systems.
 View Larger
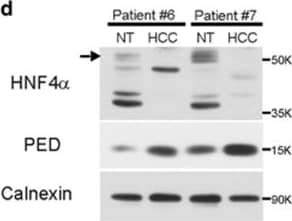
Detection of Human PEA-15 by Western Blot PED is inversely correlated to HNF4 alpha expression. (a) SNU-449 cells were co-transfected with 100 ng of pPED477 PED promoter-luciferase or pGL3 basic construct and treated with siRNA against HNF4 alpha or siRNA control. Luciferase activity was normalized for Renilla activity and is presented as mean±S.D. A representative experiment in triplicate is shown. (b,c) PED expression levels in HCC samples (b; n=59) or corresponding non-tumoral liver tissue (c, n=59) were correlated with HNF4 alpha expression. Correlation was calculated by Spearman test. Data are reported as probe intensity of an mRNA transcriptome array. (d) Western blot analysis for HNF4 alpha and PED in two HCC patient tumor samples and their corresponding non-tumoral (NT) tissues. Calnexin was used as loading control. Arrow: canonical full length HNF4 alpha (52 kDa); other bands are isoforms or truncated forms of the protein. (e,f) HuH-7 and PLC/PRF/5 cell lines were transfected with siRNA against HNF4 alpha (siHNF4 alpha ) or siRNA control. After 72 h the protein expression of HNF4 alpha and PED was measured by western blot (e) and beta -actin served as control. mRNA expression was measured by qPCR (f) using RNA 18 S as internal control at 48 h for HuH-7 and 72 h for PLC/PRF/5. Data are reported as mean±S.D. of two independent experiments performed in triplicate. (g) SNU-449 cells were transfected with siRNA against HNF4 alpha or siRNA against PED alone or in combination, or siRNA control, as indicated. Migration was assessed by CIM plate with xCELLigence apparatus after 12 h and 24 h. Data are reported as mean±S.D. of two independent experiments performed in triplicate. (h) Western blot analysis of pERKThr202/Tyr204 and ERK in SNU-449, Hep3B and HuH-7 cell lines transfected with PED-MYC. beta -Actin was used as loading control. (i) pERKThr202/Tyr204 expression in two HCC patients and their non-tumoral counterpart. Calnexin was used as loading control. *P<0.05, **P<0.01, ****P<0.0001 Image collected and cropped by CiteAb from the following publication (https://www.nature.com/articles/cddis2017512), licensed under a CC-BY license. Not internally tested by R&D Systems.
 View Larger
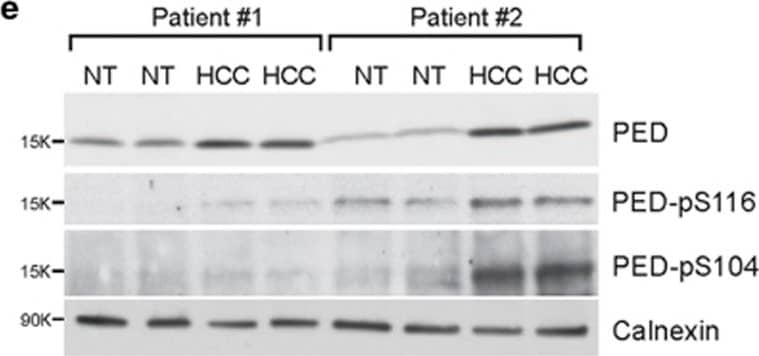
Detection of Human PEA-15 by Western Blot PED is overexpressed in HCC samples. (a) PED expression levels in HCC samples and their matched non-tumoral (NT) counterpart measured by an mRNA gene expression microarray. Data are reported as probe intensity. (b) PED mRNA was measured by qRT-PCR in a separate cohort of 14 HCC patients and compared with the 10 available non-tumoral counterpart. 18 S was used as internal control and 2− delta delta Ct formula was applied to determine relative expression levels. Statistical analysis (a,b) with paired Student t-test. (c) Representative immunohistochemical staining from an HCC tumor (left) with positive (3+) PED staining and non-tumoral liver tissue (NT) showing negative PED staining (right). Scale bar=20 μm. (d) Percentage and h-score (staining intensity × percentage of positive tumor cells) of PED positivity in HCC samples and non-tumoral (NT) liver tissues by immunohistochemistry. (e) Western blot analysis of total PED and phosphorylated PED (PED S116 and PED S104) in two HCC patient samples and their corresponding NT control tissues. Calnexin was used as internal control. *P<0.05, ***P<0.001 Image collected and cropped by CiteAb from the following publication (https://www.nature.com/articles/cddis2017512), licensed under a CC-BY license. Not internally tested by R&D Systems.
 View Larger
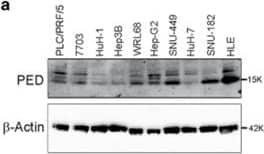
Detection of Human PEA-15 by Western Blot PED modulates cell migration. (a) Western blot analysis of PED protein expression in 10 different HCC cell lines. beta -Actin was used as loading control. (b) HuH-7 and SNU-449 cells were transfected with PED-MYC or an empty control vector as wells as with siRNA against PED (siRNA PED) or control siRNA. Cell growth properties were evaluated by using xCELLigence instrument at the time indicated. Data are reported as mean±S.D. of two independent experiments performed at least in triplicate. Difference was evaluated between PED overexpressing (PED-MYC), PED silenced (siRNA PED), empty vector transfected and a siRNA control transfected cells (two-way ANOVA test). (c) HLE, SNU-449 and HuH-7 cell lines were transfected with a vector overexpressing PED (PED-MYC) or empty control vector, siRNA against PED (siRNA PED) or siRNA control. Migration was assessed using a transwell assay after 24 h. One representative image of crystal violet stained cells at 100 × is shown above and quantification by colorimetry below. ***P<0.001, ****P<0.0001 Image collected and cropped by CiteAb from the following publication (https://www.nature.com/articles/cddis2017512), licensed under a CC-BY license. Not internally tested by R&D Systems.
Preparation and Storage
- 12 months from date of receipt, -20 to -70 °C as supplied.
- 1 month, 2 to 8 °C under sterile conditions after reconstitution.
- 6 months, -20 to -70 °C under sterile conditions after reconstitution.
Background: PEA-15
PEA-15 (Phosphoprotein Enriched in Astrocytes of 15 kDa) is a 15 kDa cytoplasmic protein that regulates cell proliferation and apoptosis. It is expressed in multiple cell types such as astrocytes; skeletal muscle and adipocytes. Human PEA-15 is 130 amino acids (aa) in length. It contains a death effector domain (aa 3‑81), plus two regulatory Ser phosphorylation sites. In a quiescent cell, it is either non-phosphorylated or constitutively phosphorylated at Ser116. Non-phosphorylated PEA-15 binds ERK, inhibiting cell proliferation. Phosphorylation at Ser116 promotes PEA-15 binding to FADD, blocking apoptosis. And activation-induced phosphorylation at Ser104 blocks PEA-15 binding to ERK, promoting cell proliferation. There is one potential alternate start site 21 aa upstream of the standard start site, and a second isoform that shows an Asn substitution for aa 36‑58. Full-length human and mouse PEA-15 show 99% aa identity.
Product Datasheets
Citation for Human/Mouse PEA-15 Antibody
R&D Systems personnel manually curate a database that contains references using R&D Systems products. The data collected includes not only links to publications in PubMed, but also provides information about sample types, species, and experimental conditions.
1 Citation: Showing 1 - 1
-
Phosphoprotein enriched in diabetes (PED/PEA15) promotes migration in hepatocellular carcinoma and confers resistance to sorafenib
Authors: Cristina Quintavalle, Sravanth Kumar Hindupur, Luca Quagliata, Pierlorenzo Pallante, Cecilia Nigro, Gerolama Condorelli et al.
Cell Death & Disease
FAQs
No product specific FAQs exist for this product, however you may
View all Antibody FAQsIsotype Controls
Reconstitution Buffers
Secondary Antibodies
Reviews for Human/Mouse PEA-15 Antibody
There are currently no reviews for this product. Be the first to review Human/Mouse PEA-15 Antibody and earn rewards!
Have you used Human/Mouse PEA-15 Antibody?
Submit a review and receive an Amazon gift card.
$25/€18/£15/$25CAN/¥75 Yuan/¥2500 Yen for a review with an image
$10/€7/£6/$10 CAD/¥70 Yuan/¥1110 Yen for a review without an image
