Human/Mouse/Rat Akt Pan Specific Antibody Summary
Ser2-Ala480
Accession # P31749
Customers also Viewed
Applications
Please Note: Optimal dilutions should be determined by each laboratory for each application. General Protocols are available in the Technical Information section on our website.
Scientific Data
 View Larger
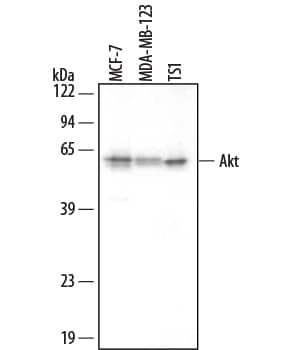
Detection of Human/Mouse Akt by Western Blot. Western blot shows lysates of MCF-7 human breast cancer cell line, MBA-MB-123 human breast cancer cell line, and TS1 mouse helper T cell line. PVDF membrane was probed with 0.2 µg/mL Mouse Anti-Human/Mouse/Rat Akt Pan Specific Monoclonal Antibody (Catalog # MAB2055) followed by HRP-conjugated Anti-Mouse IgG Secondary Antibody (Catalog # HAF007). This experiment was conducted under reducing conditions and using Immunoblot Buffer Group 4.
 View Larger
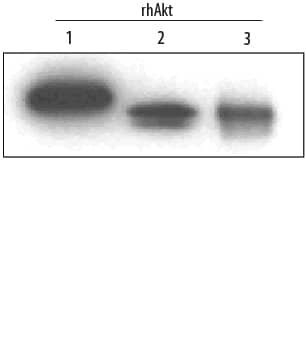
Detection of Human Akt Pan Specific by Western Blot. Western blot shows Recombinant Human Active Akt1 (Catalog # 1775-KS), recombinant human Akt2, and recombinant human Akt3 (5 ng/lane). PVDF membrane was probed with 0.2 µg/mL Mouse Anti-Human/Mouse/Rat Akt Pan Specific Monoclonal Antibody (Catalog # MAB2055) followed by HRP-conjugated Anti-Mouse IgG Secondary Antibody (Catalog # HAF007). This experiment was conducted under reducing conditions and using Immunoblot Buffer Group 4.
 View Larger
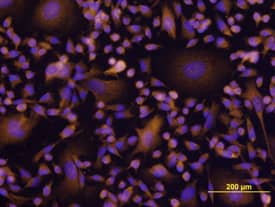
Akt in MDA‑MB‑231 Human Cell Line. Akt was detected in immersion fixed MDA-MB-231 human breast cancer cell line using Mouse Anti-Human/ Mouse/Rat Akt Monoclonal Antibody (Catalog # MAB2055) at 10 µg/mL for 3 hours at room temperature. Cells were stained using the NorthernLights™ 557-conjugated Anti-Mouse IgG Secondary Antibody (yellow; Catalog # NL007) and counter-stained with DAPI (blue). View our protocol for Fluorescent ICC Staining of Cells on Coverslips.
 View Larger
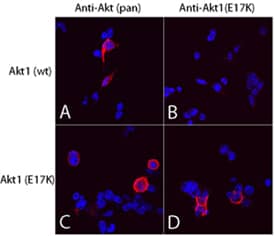
Akt (pan) in 293T Human Cell Line. Akt pan specific (panels A and C) and Akt1 (E17K Mutation) (panels B and D) were detected in immersion fixed 293T human embryonic kidney cell line transfected with wild type (panels A and B) or E17K mutated (panels C and D) Akt1 using Mouse Anti-Human/Mouse/Rat Akt Pan Specific Monoclonal Antibody (Catalog # MAB2055) and Mouse Anti-Human Akt1 (E17K Mutation) Monoclonal Antibody (Catalog # MAB6815). Both antibodies were used at 10 µg/mL for 3 hours at room temperature. Cells were stained using the NorthernLights™ 557-conjugated Anti-Mouse IgG Secondary Antibody (red; Catalog # NL007) and counterstained with DAPI (blue). Specific staining was localized to plasma membranes and cytoplasm. View our protocol for Fluorescent ICC Staining of Cells on Coverslips.
 View Larger
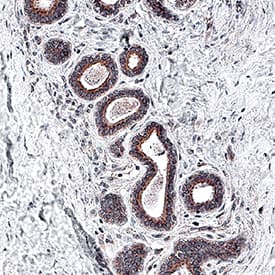
Akt Pan Specific in Human Breast Cancer Tissue. Akt was detected in immersion fixed paraffin-embedded sections of human breast cancer tissue using Mouse Anti-Human/Mouse/Rat Akt Pan Specific Monoclonal Antibody (Catalog # MAB2055) at 5 µg/mL for 1 hour at room temperature followed by incubation with the Anti-Mouse IgG VisUCyte™ HRP Polymer Antibody (VC001). Before incubation with the primary antibody, tissue was subjected to heat-induced epitope retrieval using Antigen Retrieval Reagent-Basic (CTS013). Tissue was stained using DAB (brown) and counterstained with hematoxylin (blue). Specific staining was localized to cytoplasm in epithelial cells. Staining was performed using our IHC Staining with VisUCyte HRP Polymer Detection Reagents.
 View Larger
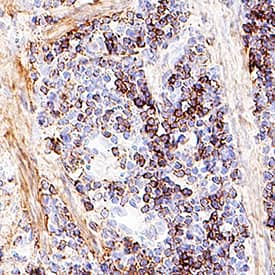
Akt Pan Specific in Mouse Spleen Tissue. Akt was detected in immersion fixed paraffin-embedded sections of mouse spleen tissue using Mouse Anti-Human/Mouse/Rat Akt Pan Specific Monoclonal Antibody (Catalog # MAB2055) at 5 µg/mL for 1 hour at room temperature followed by incubation with the Anti-Mouse IgG VisUCyte™ HRP Polymer Antibody (VC001). Before incubation with the primary antibody, tissue was subjected to heat-induced epitope retrieval using Antigen Retrieval Reagent-Basic (CTS013). Tissue was stained using DAB (brown) and counterstained with hematoxylin (blue). Specific staining was localized to cytoplasm in lymphocytes. Staining was performed using our IHC Staining with VisUCyte HRP Polymer Detection Reagents.
 View Larger
Detection of Akt in MCF‑7 Human Cell Line by Flow Cytometry. MCF-7 human breast cancer cell line was stained with Mouse Anti-Human/Mouse/Rat Akt Monoclonal Antibody (Catalog # MAB2055, filled histogram) or isotype control antibody (Catalog # MAB0041, open histogram), followed by Phycoerythrin-conjugated Anti-Mouse IgG F(ab')2Secondary Antibody (Catalog # F0102B). To facilitate intracellular staining, cells were fixed with paraformaldehyde and permeabilized with saponin.
 View Larger
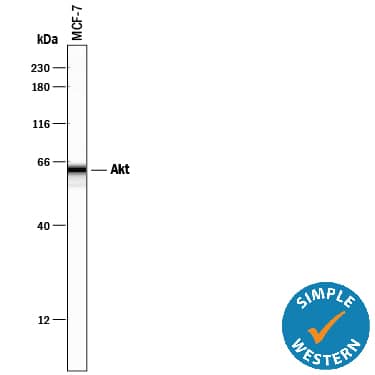
Detection of Human Akt by Simple WesternTM. Simple Western lane view shows lysates of MCF‑7 human breast cancer cell line, loaded at 0.2 mg/mL. A specific band was detected for Akt at approximately 62 kDa (as indicated) using 2 µg/mL of Mouse Anti-Human/Mouse/Rat Akt Pan Specific Monoclonal Antibody (Catalog # MAB2055). This experiment was conducted under reducing conditions and using the 12-230 kDa separation system.
 View Larger
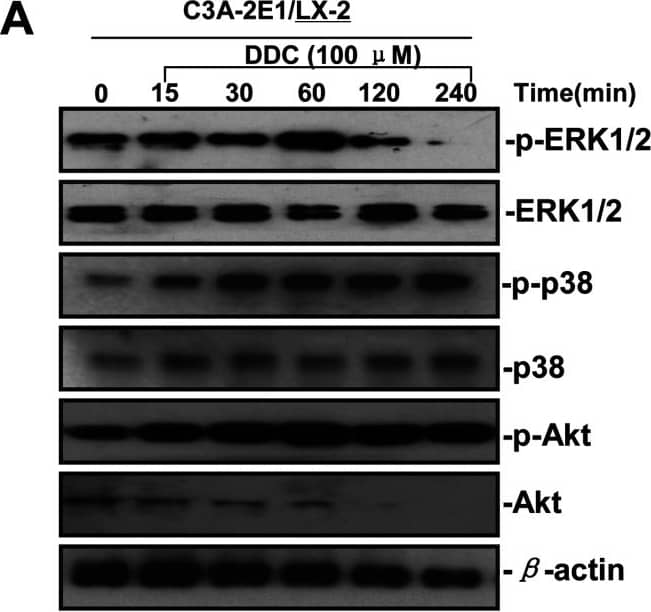
Detection of Human AKT by Western Blot DDC up-regulates MMP-1 through ERK1/2 and Akt activation(A) Co-cultures were treated with 100 μM DDC for the indicated time. Phosphorylation of ERK1/2, p38 and Akt were determined by Western blotting analysis. The corresponding non-phosphorylated ERK1/2, p38, Akt and beta -actin were used for protein loading control. (B) Co-cultures were treated with or without 100 μM DDC for 24 h in the presence or absence of ERK1/2 inhibitor (U0126, 10 μM). MMP-1 protein levels were analysed by Western blotting. (C) Co-cultures were treated with or without 100 μM DDC for 24 h in the presence or absence of p38 inhibitor (SB203580, 10 μM). MMP-1 protein levels were analysed by Western blotting. (D) Co-cultures were treated with or without 100 μM DDC for 24 h in the presence or absence of Akt inhibitor (T3830, 50 μM). MMP-1 protein levels were analysed by Western blotting. Image collected and cropped by CiteAb from the following publication (https://pubmed.ncbi.nlm.nih.gov/23577625), licensed under a CC-BY license. Not internally tested by R&D Systems.
 View Larger
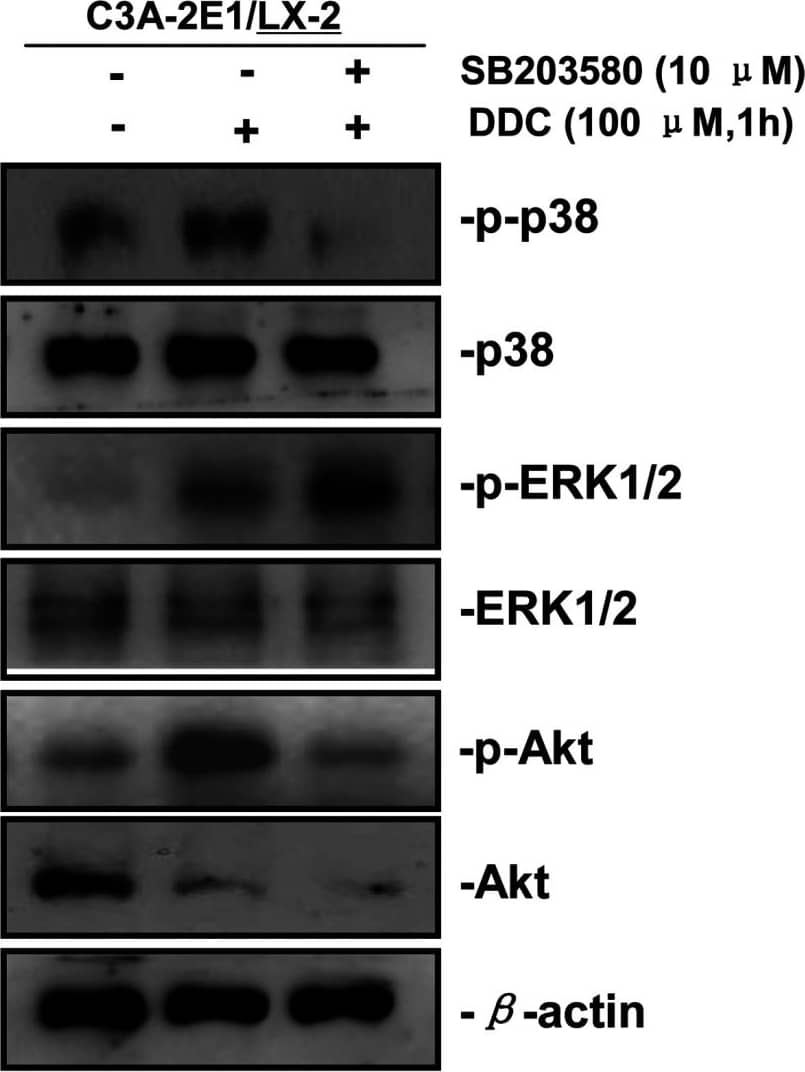
Detection of Human AKT by Western Blot p38 inhibitor SB203580 improves the up-regulation of MMP-1 by DDC through stimulating ERK1/2Co-cultures were treated with or without 100 μM DDC for 1 h in the presence or absence of p38 inhibitor (SB203580, 10 μM). Phosphorylation of ERK1/2, p38 and Akt in LX-2 cells of co-cultures were determined by Western blotting analysis. Image collected and cropped by CiteAb from the following publication (https://pubmed.ncbi.nlm.nih.gov/23577625), licensed under a CC-BY license. Not internally tested by R&D Systems.
 View Larger
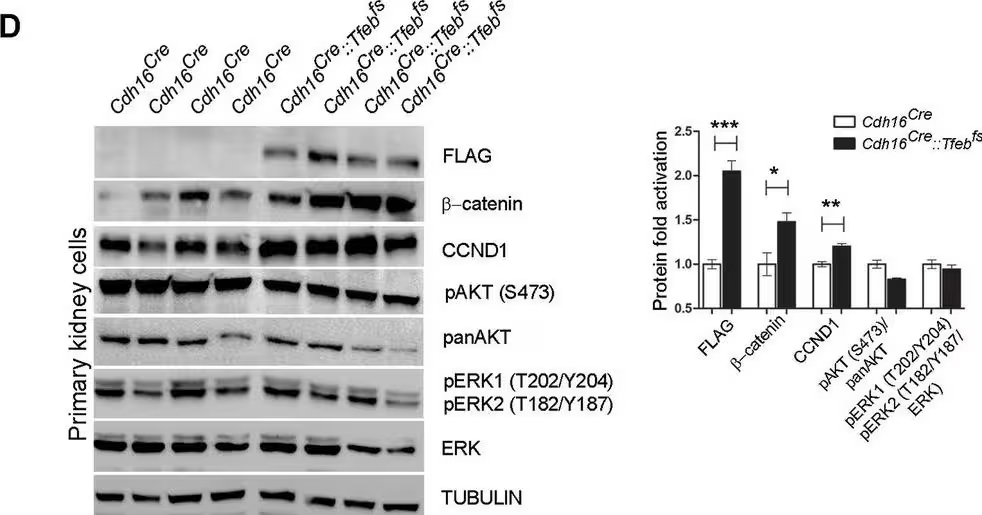
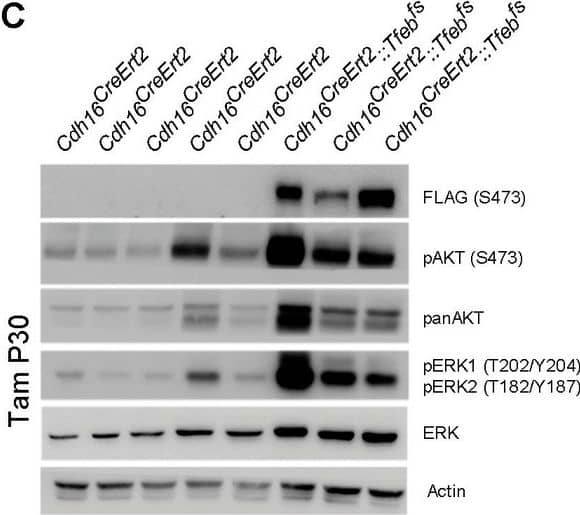
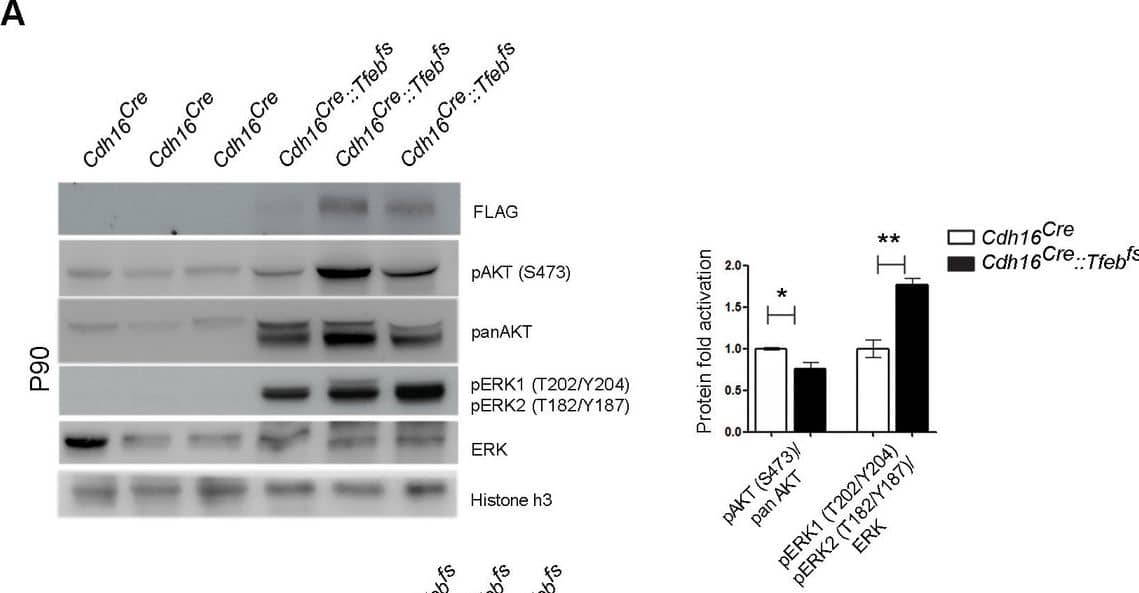
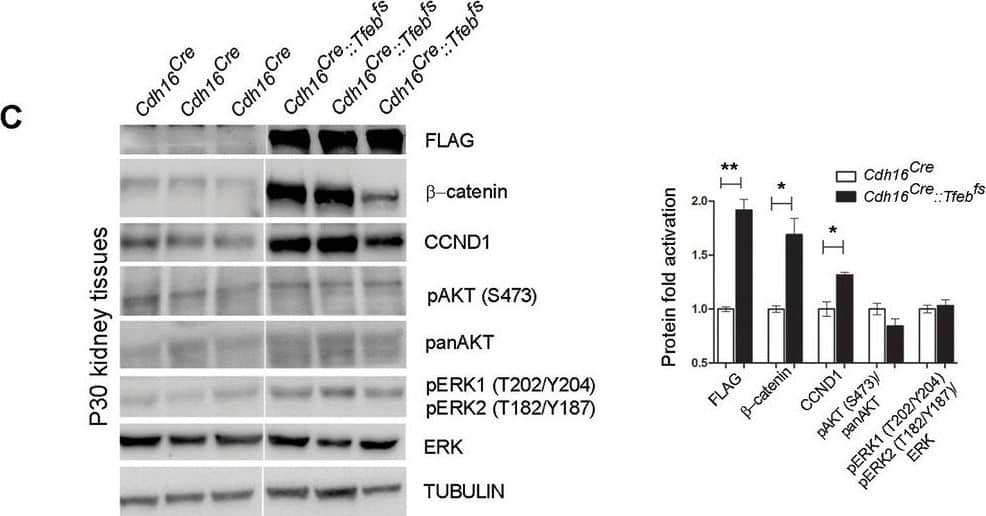
Detection of Mouse AKT by Western Blot Activation of ErbB and WNT signaling pathways in kidneys from Cdh16Cre::Tfebfs mice.Transcriptional and biochemical analyses were performed on Cdh16Cre and Cdh16Cre::Tfebfs mice. (A,B) Tables show the relative increase of genes related to the ErbB (A) and WNT (B) pathways in the microarray analyses performed on kidneys from P0 Cdh16Cre::Tfebfs mice. Graphs show real-time PCR validations performed on kidneys from Cdh16Cre::Tfebfs mice at different stages (P0, P12, P30). Data are shown as the average (± SEM) of at least three Cdh16Cre::Tfebfs mice normalized versus wild-type mice. (C,D) Immunoblot analyses performed on (C) P30 kidney tissues and (D) primary kidney cells isolated from Cdh16Cre::Tfebfs mice to evaluate ErbB and WNT activation status. Each replicate is a distinct biological sample. ErbB signaling was assessed by looking at phosphoAKT (Ser473) to total AKT ratio, and phosphoERK1 (T202/Y204)/ERK2(T185/Y187) to total ERK ratio; WNT signaling was assessed by quantifying beta -catenin and CCND1 (Cyclin D1) protein levels. Graphs represent the densitometry quantification of Western blot bands. Values are normalized to actin when not specified and are shown as an average (± SEM) (*p<0.05, **p<0.01, ***p<0.001, two-sided, Student’s t test).DOI:https://dx.doi.org/10.7554/eLife.17047.00710.7554/eLife.17047.008Figure 3—source data 1.Complete list of 294 genes (represented by 361 probesets) significantly induced (FDR≤0.05) in the KSP_P0 microarray dataset (GSE62977).The genes are ranked by decreasing signed ratio (KSP_P0/CTL).DOI:https://dx.doi.org/10.7554/eLife.17047.00810.7554/eLife.17047.009Figure 3—source data 2.Complete list of 628 genes (represented by 729 probesets) significantly induced (FDR≤0.05) in the KSP_P14 microarray dataset (GSE63376).The genes are ranked by decreasing signed ratio (KSP_P14/CTL).DOI:https://dx.doi.org/10.7554/eLife.17047.009Complete list of 294 genes (represented by 361 probesets) significantly induced (FDR≤0.05) in the KSP_P0 microarray dataset (GSE62977).The genes are ranked by decreasing signed ratio (KSP_P0/CTL).DOI:https://dx.doi.org/10.7554/eLife.17047.008Complete list of 628 genes (represented by 729 probesets) significantly induced (FDR≤0.05) in the KSP_P14 microarray dataset (GSE63376).The genes are ranked by decreasing signed ratio (KSP_P14/CTL).DOI:https://dx.doi.org/10.7554/eLife.17047.009ErbB and WNT transcriptional profiles in Cdh16CreErt2::Tfebfs mice.Transcriptional analyses performed on Cdh16CreErt2::Tfebfs mice. (A,B) mRNA levels of previously validated genes belonging to the WNT (left graphs) and ErbB (right graphs) signaling pathways assessed in P90 Cdh16CreErt2::Tfebfs mice induced at (A) P14 and at (B) P30 with tamoxifen respectively. Data are shown as the average (± SEM) of at least Cdh16CreErt2::Tfebfs mice and values are normalized to the wild-type line. (*p<0.05, **p<0.01, ***p<0.001, two-sided Student’s t test).DOI:https://dx.doi.org/10.7554/eLife.17047.010Biochemical analysis of ErbB signaling.Immunoblot analysis performed on P90 kidneys from Cdh16Cre::Tfebfs mice (A) and P90 Cdh16CreErt2::Tfebfs animals induced with tamoxifen at P14 (B) and at P30 (C), respectively. Each replicate is a different biological sample. ErbB was analyzed by quantifying phosphoAKT (Ser473) to total AKT, and phosphoERK1 (T202/Y204)/ERK2(T185/Y187) to total ERK; graphs are the densitometry quantifications of Western blot bands normalized to wild-type line and are shown as an average (± SEM) (*p<0.05, **p<0.01, ***p<0.001, two-sided Student’s t test).DOI:https://dx.doi.org/10.7554/eLife.17047.011 Image collected and cropped by CiteAb from the following publication (https://elifesciences.org/articles/17047), licensed under a CC-BY license. Not internally tested by R&D Systems.
 View Larger
Detection of Human AKT by Western Blot Phospho-proteome profiling results of LX-2 cells co-cultured with C3A–CYP2E1 cells with or without DDC treatment and detection of the effect of DDC on intracellular kinases in LX-2 cells of co-cultures200 μg of total cell lysates from LX-2 cells co-cultured with C3A-2E1 cells with or without 100 μM DDC for 1 h were incubated with membranes of the human phospho-MAPK Array Kit according to the manufacturer's instructions. Phospho MAPK Array data were developed on X-ray films following exposure to chemiluminescent reagents. 20 μg aliquots of total cell lysates from LX-2 cells were subjected to Western blotting analysis. (A) Template showing the location of MAPK antibodies spotted onto the human phospho-MAPK Array Kit. (B) The activation status of ERK1/2 in LX-2 cells co-cultured with C3A-2E1 cells after DDC treatment. (C) The activation status of p38 in LX-2 cells co-cultured with C3A-2E1 cells after DDC treatment. (D) The activation status of Akt in LX-2 cells co-cultured with C3A-2E1 cells after DDC treatment. (E) The activation status of ERK1/2, p38 and Akt in LX-2 cells co-cultured with C3A cells after DDC treatment. Image collected and cropped by CiteAb from the following publication (https://pubmed.ncbi.nlm.nih.gov/23577625), licensed under a CC-BY license. Not internally tested by R&D Systems.
 View Larger
Detection of Mouse AKT by Western Blot Biochemical analysis of ErbB signaling.Immunoblot analysis performed on P90 kidneys from Cdh16Cre::Tfebfs mice (A) and P90 Cdh16CreErt2::Tfebfs animals induced with tamoxifen at P14 (B) and at P30 (C), respectively. Each replicate is a different biological sample. ErbB was analyzed by quantifying phosphoAKT (Ser473) to total AKT, and phosphoERK1 (T202/Y204)/ERK2(T185/Y187) to total ERK; graphs are the densitometry quantifications of Western blot bands normalized to wild-type line and are shown as an average (± SEM) (*p<0.05, **p<0.01, ***p<0.001, two-sided Student’s t test).DOI:https://dx.doi.org/10.7554/eLife.17047.011 Image collected and cropped by CiteAb from the following publication (https://elifesciences.org/articles/17047), licensed under a CC-BY license. Not internally tested by R&D Systems.
 View Larger
Detection of Mouse AKT by Western Blot Activation of ErbB and WNT signaling pathways in kidneys from Cdh16Cre::Tfebfs mice.Transcriptional and biochemical analyses were performed on Cdh16Cre and Cdh16Cre::Tfebfs mice. (A,B) Tables show the relative increase of genes related to the ErbB (A) and WNT (B) pathways in the microarray analyses performed on kidneys from P0 Cdh16Cre::Tfebfs mice. Graphs show real-time PCR validations performed on kidneys from Cdh16Cre::Tfebfs mice at different stages (P0, P12, P30). Data are shown as the average (± SEM) of at least three Cdh16Cre::Tfebfs mice normalized versus wild-type mice. (C,D) Immunoblot analyses performed on (C) P30 kidney tissues and (D) primary kidney cells isolated from Cdh16Cre::Tfebfs mice to evaluate ErbB and WNT activation status. Each replicate is a distinct biological sample. ErbB signaling was assessed by looking at phosphoAKT (Ser473) to total AKT ratio, and phosphoERK1 (T202/Y204)/ERK2(T185/Y187) to total ERK ratio; WNT signaling was assessed by quantifying beta -catenin and CCND1 (Cyclin D1) protein levels. Graphs represent the densitometry quantification of Western blot bands. Values are normalized to actin when not specified and are shown as an average (± SEM) (*p<0.05, **p<0.01, ***p<0.001, two-sided, Student’s t test).DOI:https://dx.doi.org/10.7554/eLife.17047.00710.7554/eLife.17047.008Figure 3—source data 1.Complete list of 294 genes (represented by 361 probesets) significantly induced (FDR≤0.05) in the KSP_P0 microarray dataset (GSE62977).The genes are ranked by decreasing signed ratio (KSP_P0/CTL).DOI:https://dx.doi.org/10.7554/eLife.17047.00810.7554/eLife.17047.009Figure 3—source data 2.Complete list of 628 genes (represented by 729 probesets) significantly induced (FDR≤0.05) in the KSP_P14 microarray dataset (GSE63376).The genes are ranked by decreasing signed ratio (KSP_P14/CTL).DOI:https://dx.doi.org/10.7554/eLife.17047.009Complete list of 294 genes (represented by 361 probesets) significantly induced (FDR≤0.05) in the KSP_P0 microarray dataset (GSE62977).The genes are ranked by decreasing signed ratio (KSP_P0/CTL).DOI:https://dx.doi.org/10.7554/eLife.17047.008Complete list of 628 genes (represented by 729 probesets) significantly induced (FDR≤0.05) in the KSP_P14 microarray dataset (GSE63376).The genes are ranked by decreasing signed ratio (KSP_P14/CTL).DOI:https://dx.doi.org/10.7554/eLife.17047.009ErbB and WNT transcriptional profiles in Cdh16CreErt2::Tfebfs mice.Transcriptional analyses performed on Cdh16CreErt2::Tfebfs mice. (A,B) mRNA levels of previously validated genes belonging to the WNT (left graphs) and ErbB (right graphs) signaling pathways assessed in P90 Cdh16CreErt2::Tfebfs mice induced at (A) P14 and at (B) P30 with tamoxifen respectively. Data are shown as the average (± SEM) of at least Cdh16CreErt2::Tfebfs mice and values are normalized to the wild-type line. (*p<0.05, **p<0.01, ***p<0.001, two-sided Student’s t test).DOI:https://dx.doi.org/10.7554/eLife.17047.010Biochemical analysis of ErbB signaling.Immunoblot analysis performed on P90 kidneys from Cdh16Cre::Tfebfs mice (A) and P90 Cdh16CreErt2::Tfebfs animals induced with tamoxifen at P14 (B) and at P30 (C), respectively. Each replicate is a different biological sample. ErbB was analyzed by quantifying phosphoAKT (Ser473) to total AKT, and phosphoERK1 (T202/Y204)/ERK2(T185/Y187) to total ERK; graphs are the densitometry quantifications of Western blot bands normalized to wild-type line and are shown as an average (± SEM) (*p<0.05, **p<0.01, ***p<0.001, two-sided Student’s t test).DOI:https://dx.doi.org/10.7554/eLife.17047.011 Image collected and cropped by CiteAb from the following publication (https://elifesciences.org/articles/17047), licensed under a CC-BY license. Not internally tested by R&D Systems.
 View Larger
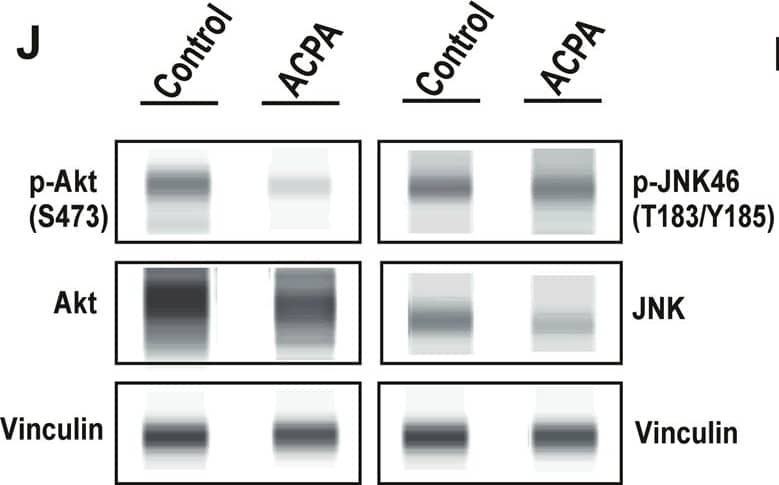
Detection of Human AKT by Simple Western ACPA inhibits p-Akt, induces p-JNK and affects levels of specific metabolites in NSCLC lines.a Principal component analysis (PCA) score plot: Metabolomics profiling of control and ACPA-treated A549, H1299, H358, and H838 cells. b Changes in variable importance in projection (VIP) values for 19 metabolites in A549 cells. c, d, e Changes in VIP values for 20 metabolites in H1299, H358, and H838 cells. Significantly changed metabolites (*p < 0.05, indicated by arrows) were matched to apoptotic pathways. f, g, h, i Increase and decrease in several metabolites of ACPA-treated A549, H1299, H358, and H838 cells (*p < 0.05). j Simple Western showing total Akt, p-Akt (S473), total JNK46 and JNK54 and p-JNK46 and p-JNK54 (T183/Y185) in A549 cells at 24 hours after treatment with IC50 dose of ACPA. k Relative expression levels of Akt and p-Akt for control and ACPA-treated A549 cells after normalization by total vinculin protein. l Relative expression levels of JNK (46 and 54 kDa) and p-JNK for control and ACPA-treated A549 cells after normalization by total vinculin protein. *p < 0.05, Student’s t-test. All tests were done in quadruplicates. Image collected and cropped by CiteAb from the following publication (https://pubmed.ncbi.nlm.nih.gov/33431819), licensed under a CC-BY license. Not internally tested by R&D Systems.
Preparation and Storage
- 12 months from date of receipt, -20 to -70 °C as supplied.
- 1 month, 2 to 8 °C under sterile conditions after reconstitution.
- 6 months, -20 to -70 °C under sterile conditions after reconstitution.
Background: Akt
Akt, also known as protein kinase B (PKB), is a central kinase in such diverse cellular processes as glucose uptake, cell cycle progression, and apoptosis. Three highly homologous members define the Akt family: Akt1 (PKB alpha ), Akt2 (PKB beta ), and Akt3 (PKB gamma ). All three Akts contain an amino-terminal pleckstrin homology domain, a central kinase domain, and a carboxyl-terminal regulatory domain.
Product Datasheets
Citations for Human/Mouse/Rat Akt Pan Specific Antibody
R&D Systems personnel manually curate a database that contains references using R&D Systems products. The data collected includes not only links to publications in PubMed, but also provides information about sample types, species, and experimental conditions.
31
Citations: Showing 1 - 10
Filter your results:
Filter by:
-
Single-Cell Spatial MIST for Versatile, Scalable Detection of Protein Markers
Authors: Meah, A;Vedarethinam, V;Bronstein, R;Gujarati, N;Jain, T;Mallipattu, SK;Li, Y;Wang, J;
Biosensors
Species: Mouse
Sample Types: Complex Sample Type
Applications: IHC -
Berberine Inhibited Growth and Migration of Human Colon Cancer Cell Lines by Increasing Phosphatase and Tensin and Inhibiting Aquaporins 1, 3 and 5 Expressions
Authors: Noor Tarawneh, Lama Hamadneh, Bashaer Abu-Irmaileh, Ziad Shraideh, Yasser Bustanji, Shtaywy Abdalla
Molecules
Species: Human
Sample Types: Cell Lysates
Applications: Western Blot -
Approaches in Hydroxytyrosol Supplementation on Epithelial-Mesenchymal Transition in TGFbeta1-Induced Human Respiratory Epithelial Cells
Authors: RA Razali, MD Yazid, A Saim, RBH Idrus, Y Lokanathan
International Journal of Molecular Sciences, 2023-02-16;24(4):.
Species: Human
Sample Types: Cell Lysates
Applications: Simple Western -
A Three-Dimensional Xeno-Free Culture Condition for Wharton's Jelly-Mesenchymal Stem Cells: The Pros and Cons
Authors: B Koh, N Sulaiman, MB Fauzi, JX Law, MH Ng, TL Yuan, AGN Azurah, MH Mohd Yunus, RBH Idrus, MD Yazid
International Journal of Molecular Sciences, 2023-02-13;24(4):.
Species: Human
Sample Types: Cell Lysates
Applications: Western Blot -
Dock7 regulates AKT and mTOR/S6K activity required for the transformed phenotypes and survival of cancer cells
Authors: OY Teran, MR Zanotelli, MJ Lin, RA Cerione, KF Wilson
bioRxiv : the preprint server for biology, 2023-01-03;0(0):.
Species: N/A
Sample Types: Recombinant Protein
Applications: Bioassay -
The proprotein convertase furin regulates the development of thymic epithelial cells to ensure central immune tolerance
Authors: Liang Z, Zhang Z, Zhang Q et al.
iScience
-
Thymoquinone Inhibits JAK/STAT and PI3K/Akt/ mTOR Signaling Pathways in MV4-11 and K562 Myeloid Leukemia Cells
Authors: Futoon Abedrabbu Al-Rawashde, Abdullah Saleh Al-wajeeh, Mansoureh Nazari Vishkaei, Hanan Kamel M. Saad, Muhammad Farid Johan, Wan Rohani Wan Taib et al.
Pharmaceuticals (Basel)
-
Hyaluronic acid restored protein permeability across injured human lung microvascular endothelial cells
Authors: Shinji Sugita, Yoshifumi Naito, Li Zhou, Hongli He, Qi Hao, Atsuhiro Sakamoto et al.
FASEB BioAdvances
-
LncCDH5-3:3 Regulates Apoptosis, Proliferation, and Aggressiveness in Human Lung Cancer Cells
Authors: K Kwa?niak, J Czarnik-Kw, K Malysheva, K Pogoda, O Korchynsky, P Rybojad, B Karczmarek, J Tabarkiewi
Cells, 2022-01-23;11(3):.
Species: Human
Sample Types: Cell Lysates
Applications: Western Blot -
Alternative splicing of NF-YA promotes prostate cancer aggressiveness and represents a new molecular marker for clinical stratification of patients
Authors: Silvia Belluti, Valentina Semeghini, Giovanna Rigillo, Mirko Ronzio, Daniela Benati, Federica Torricelli et al.
Journal of Experimental & Clinical Cancer Research
-
A growth-factor-activated lysosomal K+ channel regulates Parkinson's pathology
Authors: J Wie, Z Liu, H Song, TF Tropea, L Yang, H Wang, Y Liang, C Cang, K Aranda, J Lohmann, J Yang, B Lu, AS Chen-Plotk, KC Luk, D Ren
Nature, 2021-01-27;0(0):.
Species: Human, Mouse, Transgenic Mouse
Sample Types: Cell Lysates
Applications: Western Blot -
ACPA decreases non-small cell lung cancer line growth through Akt/PI3K and JNK pathways in vitro
Authors: Ö Boyac?o?lu, E Bilgiç, C Varan, E Bilensoy, E Nemutlu, D Sevim, Ç Kocaefe, P Korkusuz
Cell Death & Disease, 2021-01-11;12(1):56.
Species: Human
Sample Types: Cell Lysates
Applications: Western Blot -
Multiplex coherent anti-Stokes Raman scattering microspectroscopy detection of lipid droplets in cancer cells expressing TrkB
Authors: T Guerenne-D, V Couderc, L Duponchel, V Sol, P Leproux, JM Petit
Sci Rep, 2020-10-07;10(1):16749.
Species: Human
Sample Types: Cell Lysates
Applications: Western Blot -
Theophylline and dexamethasone in combination reduce inflammation and prevent the decrease in HDAC2 expression seen in monocytes exposed to cigarette smoke extract
Authors: Xue‑Jiao Sun, Zhan‑Hua Li, Yang Zhang, Xiao‑Ning Zhong, Zhi‑Yi He, Ji‑Hong Zhou et al.
Experimental and Therapeutic Medicine
Species: Human
Sample Types: Cell Lysates
Applications: Western Blot -
Jejunal Insulin Signalling Is Increased in Morbidly Obese Subjects with High Insulin Resistance and Is Regulated by Insulin and Leptin
Authors: C Gutierrez-, A Ho-Plagaro, C Santiago-F, S Garcia-Ser, F Rodríguez-, S Valdes, L Garrido-Sa, C Rodríguez-, C López-Góme, FJ Moreno-Rui, G Alcain-Mar, A Gautier-St, G Mithieux, E Garcia-Fue
J Clin Med, 2020-01-10;9(1):.
Species: Human
Sample Types: Tissue Homogenates
Applications: Western Blot -
C16 Peptide Promotes Vascular Growth and Reduces Inflammation in a Neuromyelitis Optica Model
Authors: H Chen, X Fu, J Jiang, S Han
Front Pharmacol, 2019-12-03;10(0):1373.
Species: Rat
Sample Types: Whole Tissue
Applications: IHC -
MicroRNA‑214 suppresses the viability, migration and invasion of human colorectal carcinoma cells via targeting transglutaminase 2
Authors: Huiguo Shan, Xuefeng Zhou, Chuanjun Chen
Molecular Medicine Reports
-
Knockdown of anti-silencing function 1B histone chaperone induces cell apoptosis via repressing PI3K/Akt pathway in prostate cancer
Authors: Guangye Han, Xinjun Zhang, Pei Liu, Quanfeng Yu, Zeyu Li, Qinnan Yu et al.
International Journal of Oncology
-
Subthalamic Nucleus Deep Brain Stimulation Employs trkB Signaling for Neuroprotection and Functional Restoration
Authors: DL Fischer, CJ Kemp, A Cole-Strau, NK Polinski, KL Paumier, JW Lipton, K Steece-Col, TJ Collier, DJ Buhlinger, CE Sortwell
J. Neurosci., 2017-06-12;37(28):6786-6796.
Species: Mouse
Sample Types: Whole Tissue
Applications: IHC-Fr -
Adipocyte SIRT1 controls systemic insulin sensitivity by modulating macrophages in adipose tissue
Authors: X Hui, M Zhang, P Gu, K Li, Y Gao, D Wu, Y Wang, A Xu
EMBO Rep, 2017-03-07;0(0):.
Species: Mouse
Sample Types: Tissue Homogenates
Applications: Western Blot -
Endocrine responses and acute mTOR pathway phosphorylation to resistance exercise with leucine and whey
Authors: MT Lane, TJ Herda, AC Fry, MA Cooper, MJ Andre, PM Gallagher
Biol Sport, 2017-01-20;34(2):197-203.
Species: Human
Sample Types: Tissue Homogenates
Applications: Infared Microscopy, Western Blot -
17 beta -estradiol suppresses hyperoxia-induced apoptosis of oligodendrocytes through paired-immunoglobulin-like receptor B
Authors: HUA WANG, JINLIN WU
Molecular Medicine Reports
Species: Rat
Sample Types: Cell Lysates
Applications: Western Blot -
Lack of CD2AP disrupts Glut4 trafficking and attenuates glucose uptake in podocytes.
Authors: Tolvanen T, Dash S, Polianskyte-Prause Z, Dumont V, Lehtonen S
J Cell Sci, 2015-11-06;128(24):4588-600.
Species: Mouse
Sample Types: Cell Lysates
Applications: Western Blot -
Proteomic analysis of zoledronic-acid resistant prostate cancer cells unveils novel pathways characterizing an invasive phenotype
Authors: Maria Rita Milone, Biagio Pucci, Katia Bifulco, Federica Iannelli, Rita Lombardi, Chiara Ciardiello et al.
Oncotarget
-
Novel regulation of CD80/CD86-induced phosphatidylinositol 3-kinase signaling by NOTCH1 protein in interleukin-6 and indoleamine 2,3-dioxygenase production by dendritic cells.
Authors: Koorella C, Nair J, Murray M, Carlson L, Watkins S, Lee K
J Biol Chem, 2014-01-10;289(11):7747-62.
Species: Human
Sample Types: Cell Lysates
Applications: Western Blot -
Trop2 regulates the proliferation and differentiation of murine compact-bone derived MSCs
Authors: JIANYE YANG, ZHAOHUI ZHU, HONGFEI WANG, FEIFEI LI, XINLING DU, RUNLIN Z. MA
International Journal of Oncology
-
Single amino Acid substitutions in the chemotactic sequence of urokinase receptor modulate cell migration and invasion.
Authors: Bifulco, Katia, Longanesi-Cattani, Immacola, Franco, Paola, Pavone, Vincenzo, Mugione, Pietro, Di Carluccio, Gioconda, Masucci, Maria Te, Arra, Claudio, Pirozzi, Giuseppe, Stoppelli, Maria Pa, Carriero, Maria Vi
PLoS ONE, 2012-09-25;7(9):e44806.
Species: Human
Sample Types: Cell Lysates
Applications: Western Blot -
Overexpressing cellular repressor of E1A-stimulated genes protects mesenchymal stem cells against hypoxia- and serum deprivation-induced apoptosis by activation of PI3K/Akt.
Authors: Deng J, Han Y, Yan C, Tian X, Tao J, Kang J, Li S
Apoptosis, 2010-04-01;15(4):463-73.
Species: Rat
Sample Types: Cell Lysates
Applications: Western Blot -
Cellular repressor of E1A-stimulated genes inhibits human vascular smooth muscle cell apoptosis via blocking P38/JNK MAP kinase activation.
Authors: Han Y, Wu G, Deng J, Tao J, Guo L, Tian X, Kang J, Zhang X, Yan C
J. Mol. Cell. Cardiol., 2010-01-06;48(6):1225-35.
Species: Human
Sample Types: Cell Lysates
Applications: Western Blot -
Bif-1 deficiency impairs lipid homeostasis and causes obesity accompanied by insulin resistance.
Authors: Liu Y, Takahashi Y, Desai N et al.
Sci Rep
-
Placenta-specific protein 1 promotes cell proliferation and invasion in non-small cell lung cancer
Authors: L Yang, TQ Zha, X He, L Chen, Q Zhu, WB Wu, FQ Nie, Q Wang, CS Zang, ML Zhang, J He, W Li, W Jiang, KH Lu
Oncol. Rep., 2017-11-09;39(1):53-60.
FAQs
No product specific FAQs exist for this product, however you may
View all Antibody FAQsIsotype Controls
Reconstitution Buffers
Secondary Antibodies
Reviews for Human/Mouse/Rat Akt Pan Specific Antibody
Average Rating: 4.5 (Based on 2 Reviews)
Have you used Human/Mouse/Rat Akt Pan Specific Antibody?
Submit a review and receive an Amazon gift card.
$25/€18/£15/$25CAN/¥75 Yuan/¥2500 Yen for a review with an image
$10/€7/£6/$10 CAD/¥70 Yuan/¥1110 Yen for a review without an image
Filter by:
